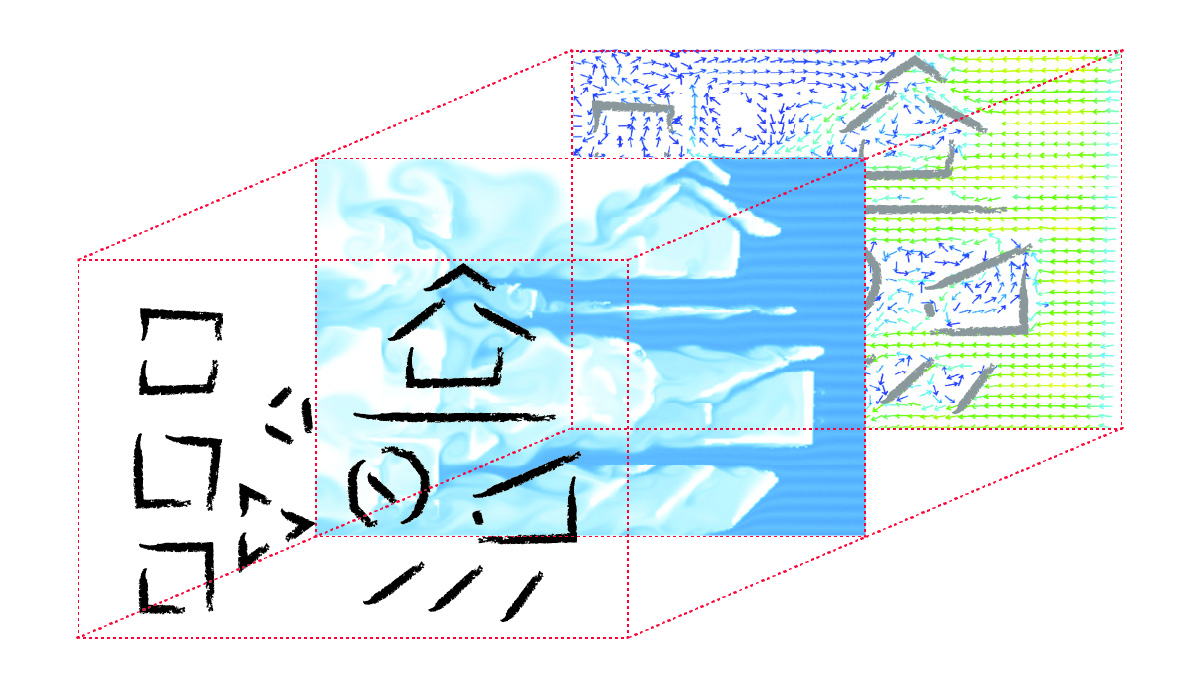
ChromaFlow: Interactive Projection-Mapped Wind Tunnel for Architectural Airflow Analysis
Faculty of Architecture Rangsit University
Asst. Prof. Songsak Onsuwan, Asst. Prof. Korapong Karnasuta, and Asst. Prof. Paiboon Kittikul
Abstract :
In architectural and urban design processes, considering the direction and circulation of airflow is a critical factor in environmental design. Currently, testing aerodynamic behaviors primarily relies on physical wind tunnel experiments and Computational Fluid Dynamics (CFD) software. Both tools are typically utilized during the later stages of a project, once the design has been finalized into complex geometric forms. However, during the Conceptual Design Phase—where architects need to explore a wide variety of possibilities—relying on tools that require complex data preparation and significant time investments can disrupt the natural workflow of design iteration. This paper presents ChromaFlow: Interactive Projection-Mapped Wind Tunnel for Architectural Airflow Analysis, a project developed to provide an intuitive tool that reduces software complexity and delivers rapid visual feedback, allowing designers to immediately apply analytical insights to their ongoing work.
This project addresses the gap in the early design phase by introducing a Tangible User Interface (TUI) that transforms a standard whiteboard and markers into an engineering analysis tool. The system integrates three core technologies: 1) Computer Vision (OpenCV) for perspective correction and the extraction of physical sketch contours; 2) GPU-accelerated real-time Fluid Dynamics Simulation (PixelFlow) that renders quantitative wind velocity as a Heatmap Vector Field; and 3) Projection Mapping (Keystone) to seamlessly superimpose the digital airflow onto the physical ink strokes.
The developmental results indicate that ChromaFlow successfully generates a real-time visualization of wind circulation around drawn architectural forms. This innovation significantly accelerates the rapid prototyping process. Furthermore, the tool fosters an Active Learning environment, providing designers and architecture students with the opportunity to tangibly experiment and interact with natural fluid dynamics through augmented reality.
Objectives :
The research and development of the ChromaFlow project aims to achieve the following primary objectives:
- To develop an Interactive Fluid Dynamics Wind Tunnel Simulation: A system capable of processing microclimate data in real time by utilizing computer vision technology to extract physical sketches directly from a pen stroke, converting them into computational physics boundaries to shorten the time required for rapid conceptual prototyping.
- To create an innovative educational medium for architectural environments: A tool designed to promote Active Learning and Interactive Learning. It enables learners to assess spatial impacts, observe multi-directional airflow behaviors around structures, and read quantitative wind velocity through an augmented reality environment concretely.
- To apply Projection Mapping technology in transforming physical spaces: To convert a traditional sketching board into an Augmented Space capable of efficiently reflecting the results of fluid dynamics simulations directly back onto the physical ink strokes.
Conceptual Framework :
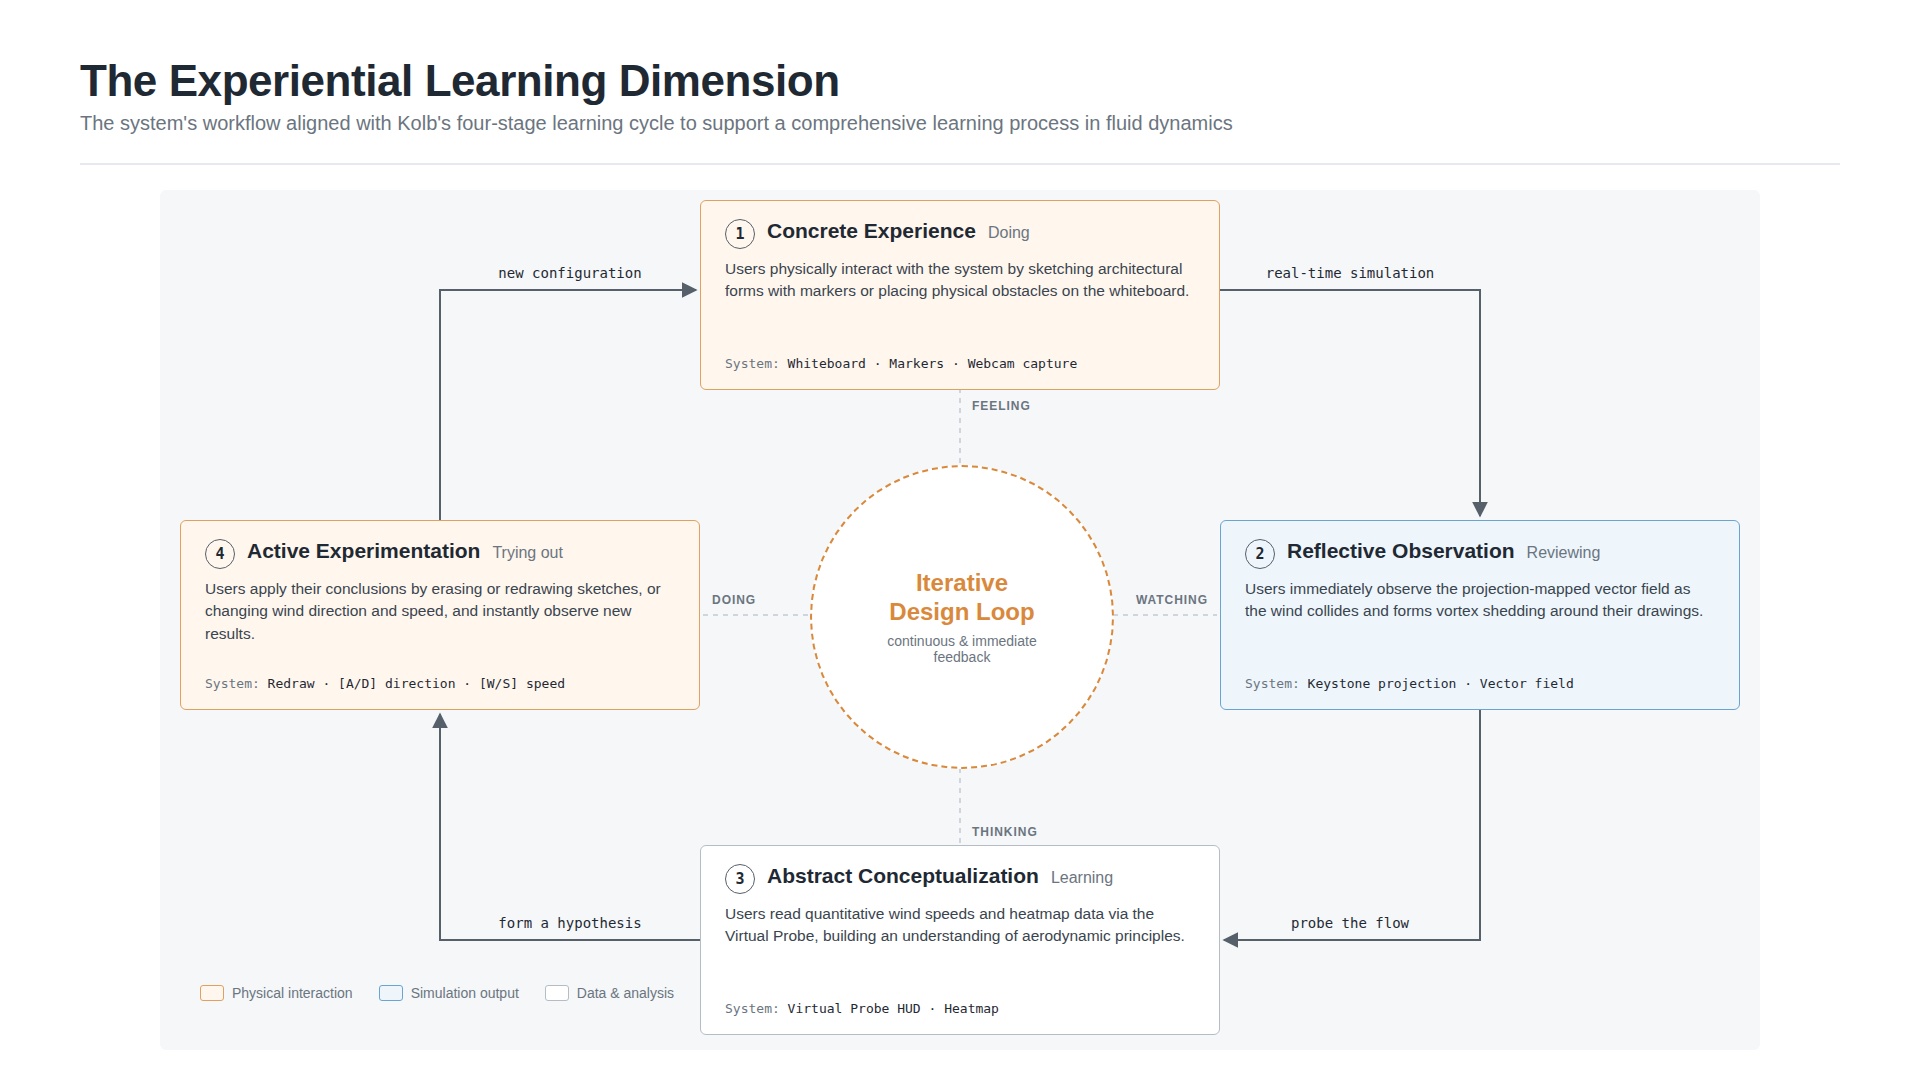
The ChromaFlow project was developed by applying David Kolb’s Experiential Learning Theory (Kolb, 1984) to construct a comprehensive design environment and learning process for fluid dynamics. The system’s framework is aligned with Kolb’s four-stage learning cycle:
- Concrete Experience: Users engage in hands-on practice by using a marker to sketch architectural forms or placing physical obstacles on a whiteboard, constituting direct physical interaction (Doing).
- Reflective Observation: Users immediately observe the outcomes through the projection-mapped Vector Field, watching how the wind collides and forms vortex shedding around their specific drawings to review the phenomena (Reviewing).
- Abstract Conceptualization: Users comprehend complex physics principles by reading quantitative wind speeds and heatmap data via a Virtual Probe, leading to the formulation of conclusions regarding wind generation and circulation (Learning from experience).
- Active Experimentation: Users apply their conclusions by conducting repeated tests—erasing lines to modify building shapes or pressing buttons to alter wind direction and speed—to instantly observe new outcomes (Trying out what was learned). This generates a highly efficient Iterative Design Loop.
Process / Methodology :
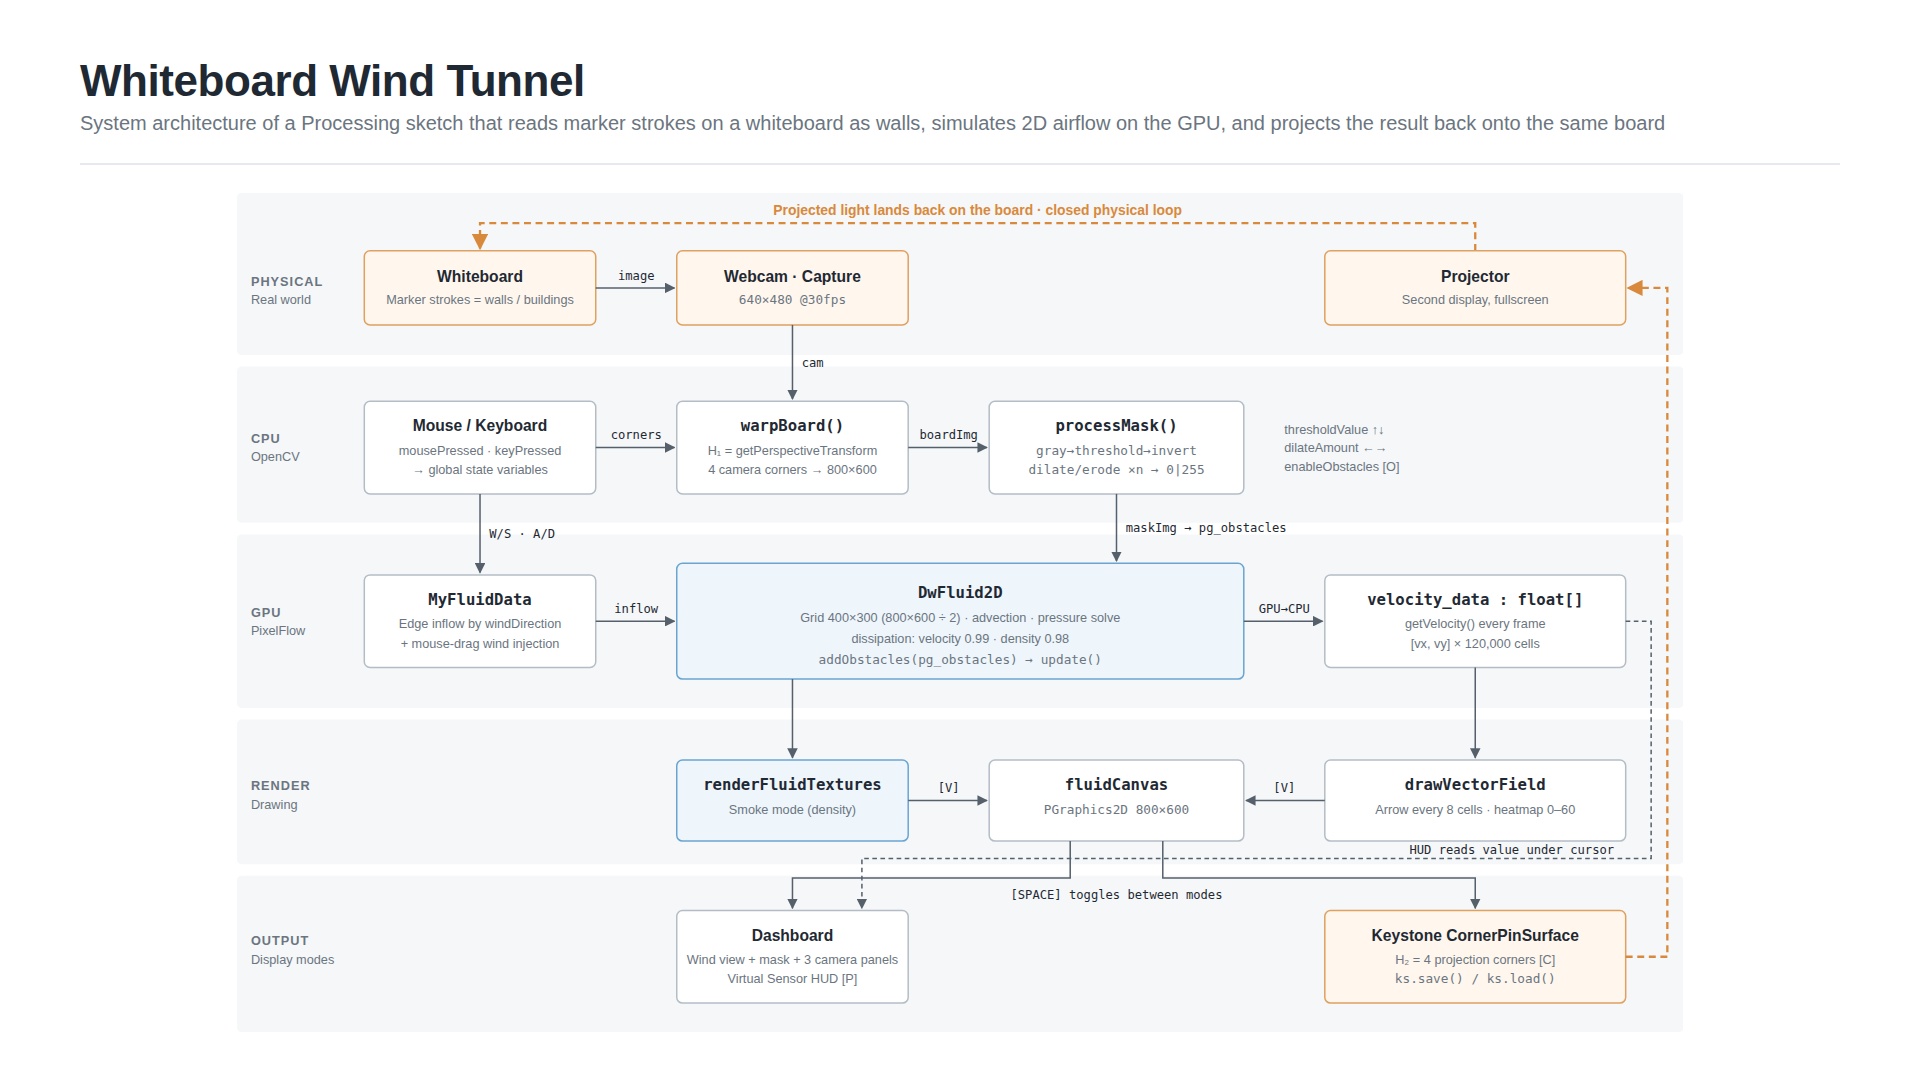
For the software architecture of ChromaFlow, Processing—an open-source Integrated Development Environment (IDE) designed for digital arts and visual computing—was selected as the core development platform. Its primary advantages include the capacity for rapid prototyping and the flexibility to seamlessly integrate hardware, serving as a hub between the input device (webcam) and the output device (projector). The system operates continuously and synchronously, divided into three main operational phases:
Phase 1: Computer Vision
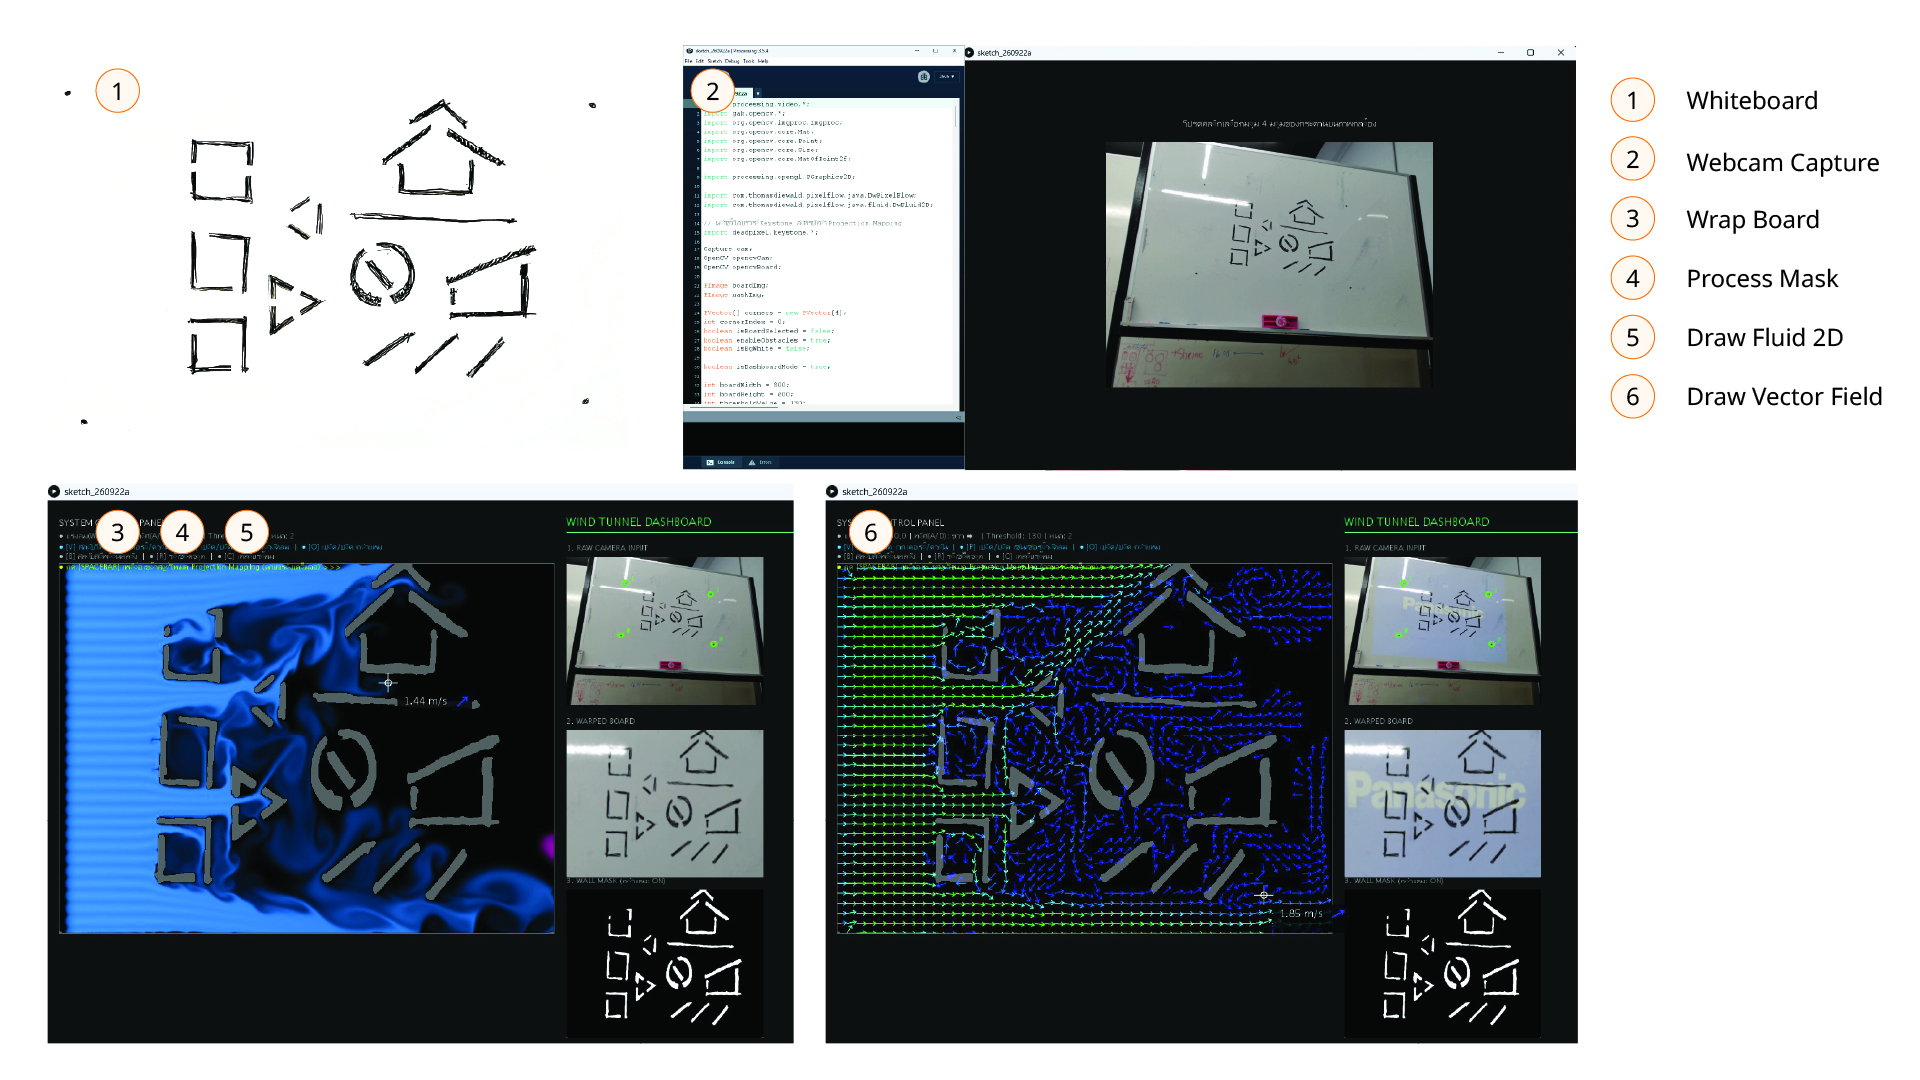
The system begins by capturing the physical architectural sketch via an overhead webcam, processing the feed using the OpenCV library to extract obstacle data:
- Perspective Transformation: A Homography Matrix is calculated based on the board’s four corners to correct camera distortion (Perspective Warp), ensuring the sketch plane is perfectly orthogonal to the computational grid.
- Contour Extraction: The image is converted to grayscale, and Thresholding is applied in conjunction with Morphological Closing techniques (Dilation to seal ink gaps and Erosion to restore stroke proportions). This transforms the ink traces into a solid, transparent obstacle mask for physics calculations.
Phase 2: Fluid Dynamics Simulation
The obstacle mask data is transmitted to the Graphics Processing Unit (GPU) via the PixelFlow library to simulate wind behaviors:
- Physics Computation: The system utilizes Navier-Stokes Equations (Batchelor, 2000), employing algorithms optimized for real-time processing (Stam, 1999), to calculate pressure and wind velocity as air masses collide with the defined boundaries. This realistically generates deflection and vortex shedding phenomena.
- Vector Field Rendering: The system fetches quantitative velocity data to generate a Vector Field, drawing wind direction lines and applying a color-coded Heatmap corresponding to the wind speed levels.
Phase 3: Projection Mapping
The simulation results are translated back into the physical world:
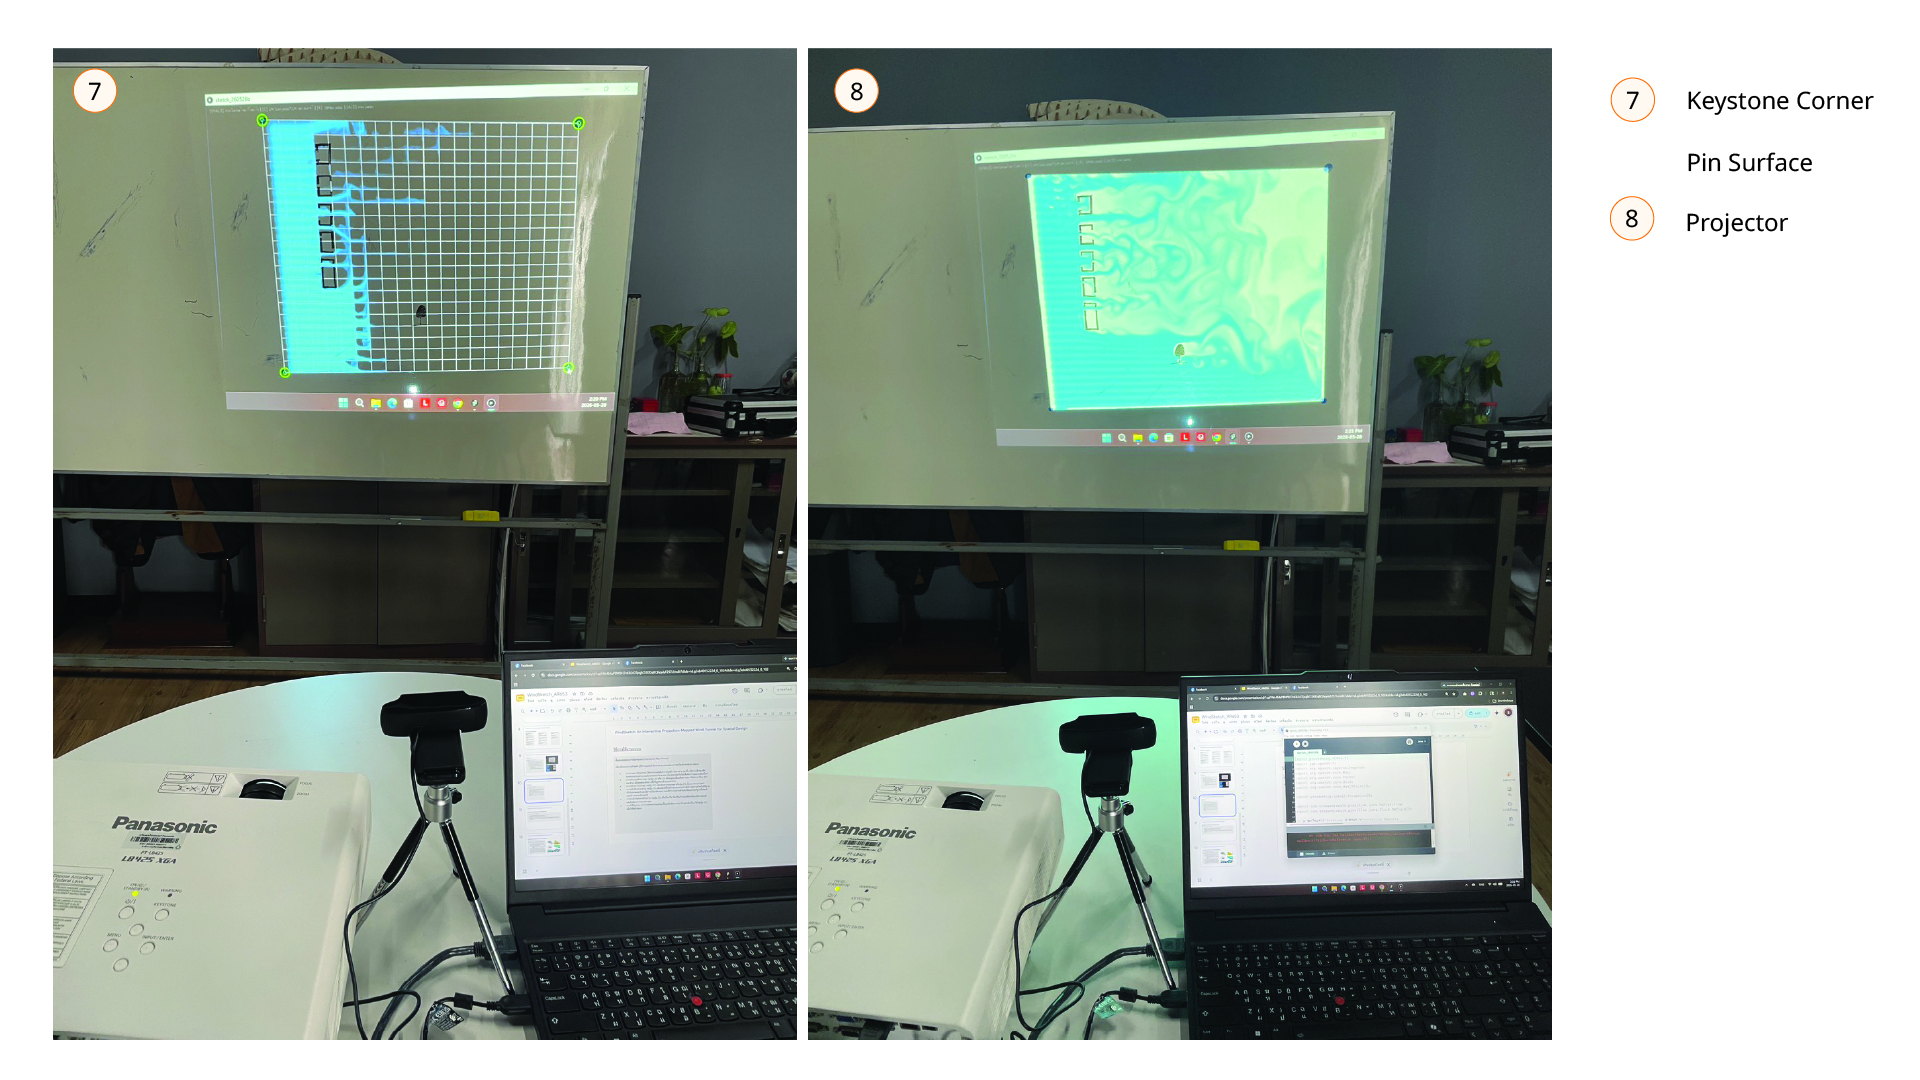
- Corner Pinning: The Keystone library is used to distort the mesh surface of the airflow render, allowing the projector’s light to flawlessly superimpose onto the physical whiteboard’s boundaries.
- Virtual Probe HUD: A digital interface system is integrated, allowing users to hover over any physical coordinate on the board to read real-time quantitative wind velocity
Techniques and Materials :
AI-generated prompts must be indicated below.*
AI was used for Coding Development Process.
Result / Conclusion :
1. System Performance Results
Through the integration of computer vision and GPU-accelerated fluid dynamics, ChromaFlow successfully processes and generates a real-time visualization of a vector field superimposed on physical sketches. The Virtual Probe can instantly display quantitative wind velocity at specific physical coordinates. This significantly reduces the complexity and time required for rapid iteration during the early conceptual design phase.
2. Collaborative Analysis
ChromaFlow is deliberately designed to bridge gaps in the early conceptual design phase and is not intended to replace standard CFD software used in final design stages, as conventional CFD provides a different depth of rigorous computational accuracy. However, ChromaFlow’s distinct advantage lies in its “Collaborative Space” functionality. While typical computer software simulations foster individual, screen-bound use, ChromaFlow transforms a sketchboard into an interactive platform where users can gather, discuss, point out specific features, and collaboratively edit drawings simultaneously. This effectively cultivates a peer-to-peer learning environment and stimulates collective understanding among groups.
3. Conclusion and Future Work
ChromaFlow succeeds in synthesizing fluid dynamics knowledge with the early-stage architectural design process through Augmented Reality technology. The tool concretely enables architecture students and designers to observe and comprehend wind behaviors. For future development, the project aims to integrate real-world weather data via APIs and develop a 3D building height analysis system based on ink color density, further enhancing its microclimate analysis capabilities.
References :
Kolb, D. A. (1984). Experiential Learning: Experience as the Source of Learning and Development. Englewood Cliffs, NJ: Prentice-Hall.
Batchelor, G. K. (2000). An Introduction to Fluid Dynamics. Cambridge University Press.
Stam, J. (1999). Stable Fluids. Proceedings of the 26th Annual Conference on Computer Graphics and Interactive Techniques (SIGGRAPH ’99), 121–128
Share :
Facebook
Twitter
LinkedIn
WhatsApp
Email
Print